July 31 – Aug. 2: BART track construction between Millbrae, SFO, and San Bruno may affect Caltrain connections. Plan ahead and review BART & Caltrain Transfers page.
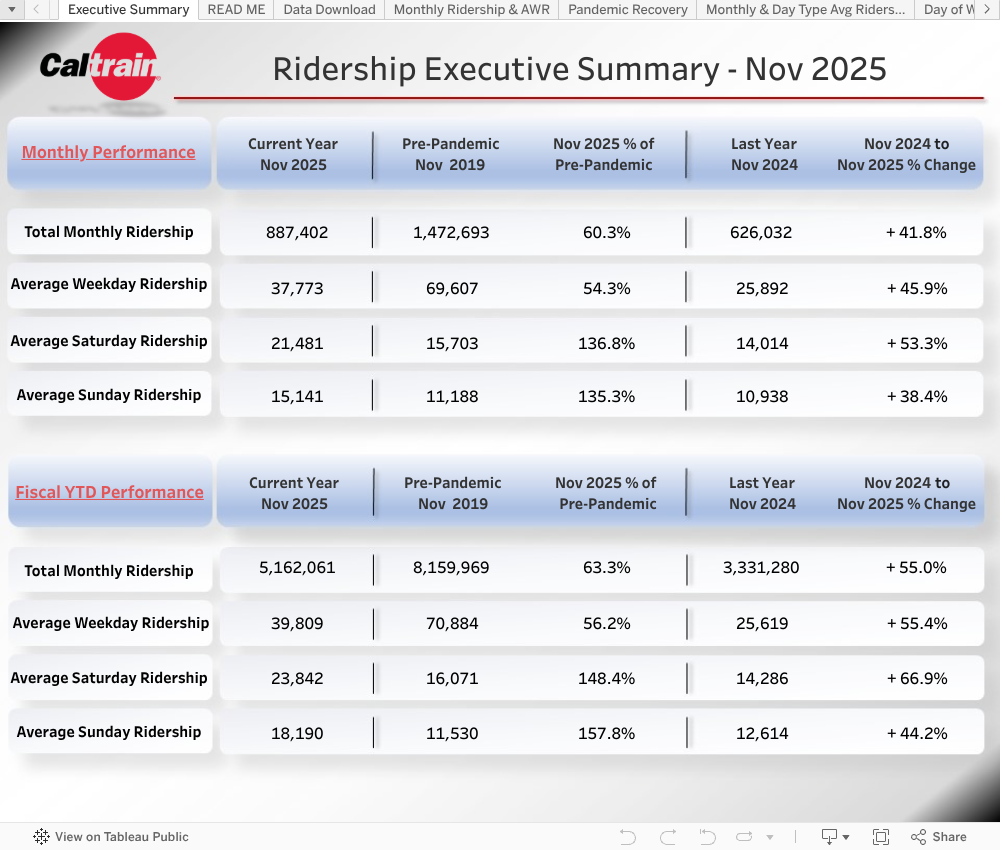
Because Caltrain operates as a proof-of-payment system without fare gates, monthly ridership must be estimated using sales data from the various fare media passengers use to pay for their trips. Fare media sales-based ridership estimates are reported each month to the Caltrain Board of Directors in the Executive Director’s Monthly Report.
Caltrain’s monthly ridership estimates are generated using different data sources and estimation methodologies than those used for the National Transit Database (NTD) reports or the historical Caltrain Annual Passenger Count. For more details, please visit the links below.
National Transit Database (NTD) Ridership
Methodology
Prior to April 2020: Ridership was estimated using a model calibrated with data from the Annual Passenger Count and the Triennial Survey, alongside fare media sales.
April 2020 through October 2023: In response to the COVID-19 pandemic and resulting shifts in travel behavior, estimates were calculated using a combination of Clipper tap data and limited conductor counts.
November 2023 through December 2024: Caltrain adopted a simplified, automated fare media sales-based model.
January 2025, onward: Following findings from the 2024 Origin & Destination Survey, the average number of rides per monthly pass was updated from 26 to 37 trips per pass per month, weighted by day of week.
Additional Notes
- Ridership refers to total boardings across the system and does not include alightings.
- Average Weekday Ridership (AWR) refers to boardings that occur Monday-Friday, excluding holidays.
- Monthly ridership estimates are typically available on the 10th of the following month.
- Estimates incorporate live data feeds and may be updated slightly after the 10th as new fare media sales data is received.
- Ridership estimates for Origin Station, Ticket Type, Fare Type and Fare Media Channel are only available from November 2023, onward
Caltrain Ridership Dashboard
Use the dropdown in the upper lefthand corner of the dashboard to navigate to tabs with different visualizations of the monthly ridership estimates.